Debugging and testing your application is paramount
if you wish to provide users with a robust application. Xcode provides
several excellent tools for debugging and testing your applications. In
this section, you explore basic debugging using Xcode’s graphical front
end to the GNU debugger.
Note
For a more complete introduction to debugging, refer to Apple’s “Xcode Debugging Guide,” available online.
Using the Debugger
Xcode’s
visual debugger makes it easy to step through the execution of your
app, examine variable values, etc. When you select View | Navigators |
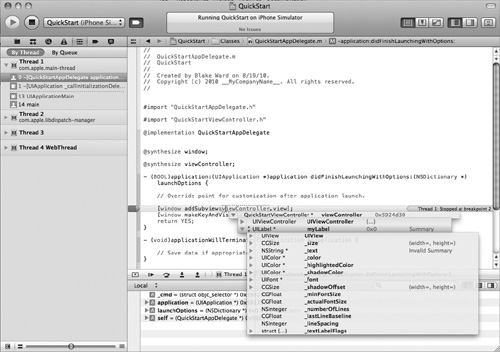
Debugger from the main menu, you’ll see the debugger’s panes (Figure 1).
The left (navigation) pane shows the app’s threads and the call stack
for each. This tells you where your application is currently at in any
point in the application’s processing. The main pane on the right is the
Text Editor pane, which displays the source code for the method, lets
you set/remove breakpoints, and also permits you to view the values of
variables by hovering over them. If you select View | Show Debugger Area
from the main menu, you’ll see the debugger area at the bottom of the
window. This pane lets you control execution of your app, see/edit the
current function’s variable values, and view the contents of the console
(log file).
Along the top of the
debugger area, notice the buttons that control the debugger. From left
to right, they are Continue, Step Over, Step Into, and Step Out. To the
right of them you’ll see the current stack. Table 1 summarizes each button’s purpose.
Table 1. Debugger Area Buttons
| Button | Function |
|---|
| Pause/Continue | Pauses
the application running in the debugger. Note, when the application is
paused, this button says Continue. Continue “un-pauses” the application
and resumes processing. |
| Step Over | Processes the next line of code. If the next line is a function call, it executes the function, proceeding to the next line. |
| Step Into | Processes the next line of code. If the line is a function call, it jumps to the code inside the function. |
| Step Out | Processes until the current function exits and stops in the function that called it. |
Breakpoints
Breakpoints tell the debugger
where to pause. If you set no breakpoints and then run the application
in the debugger, nothing unusual happens, as you didn’t tell the
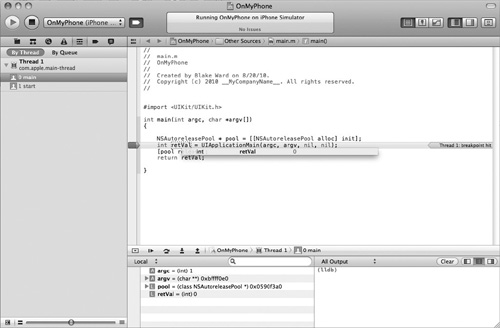
application to pause. There are several ways to set a breakpoint, but
the easiest is to click in the Editor window’s gutter next to the line
of code you wish the debugger to stop at (Figure 2). If you wish to disable the breakpoint, click it again and it turns light blue, indicating it is disabled. If you wish to remove the breakpoint, CTRL-click
and select Remove Breakpoint from the pop-up menu. Alternatively, you
can drag the breakpoint off the gutter to remove it. When you run the
application in the debugger, it will pause processing at the first
encountered breakpoint.
Stepping Through Code
When an application pauses at a
breakpoint, you can step through your code’s execution. Step Over moves
directly to the next line, executing any function and stopping on the
next line. Step Into also moves to the next line, but if the next line
is a function, it jumps to the function’s first line, and you can either
step through the function line by line or step out of the function. If
you choose Step Out, the debugger jumps to the first line after the
function call.
Debugger Datatips
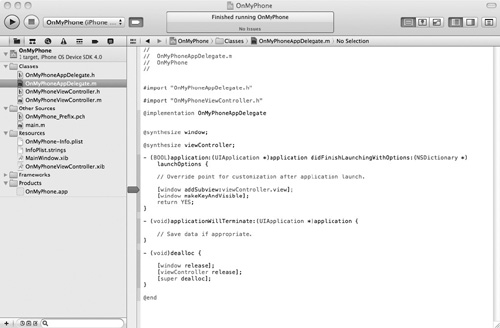
One thing you can do while
debugging is obtain a variable’s value and modify it while debugging.
You can move your cursor over the variable in the source code, and a
datatip appears with the variable and its value (Figure 3). You can even modify the value if desired.